The convenience of technology with the intelligence of A.I. brings to you

The Scoop

for tracking and monitoring fido's excretory habits

Track Outings with Notes

Simple interface for recording notes from an outing that automatically updates to Fido's aggregated data

Monitor Behavior Over Time

Have a convenient interface and display options for helpful summary information with ability to filter records

Model Analysis & Self-Tuning

After ample observations, the model will detect trends/anomolies in the data or and predict expected outing time(s)


. . .


The Need


There are a number of reasons why The Scoop could be a beneficial addition to your resources as a pet owner - and remember to always consult the primary veterinarian for fido if you ever have any concerns or questions regarding the health of your pet(s) :)


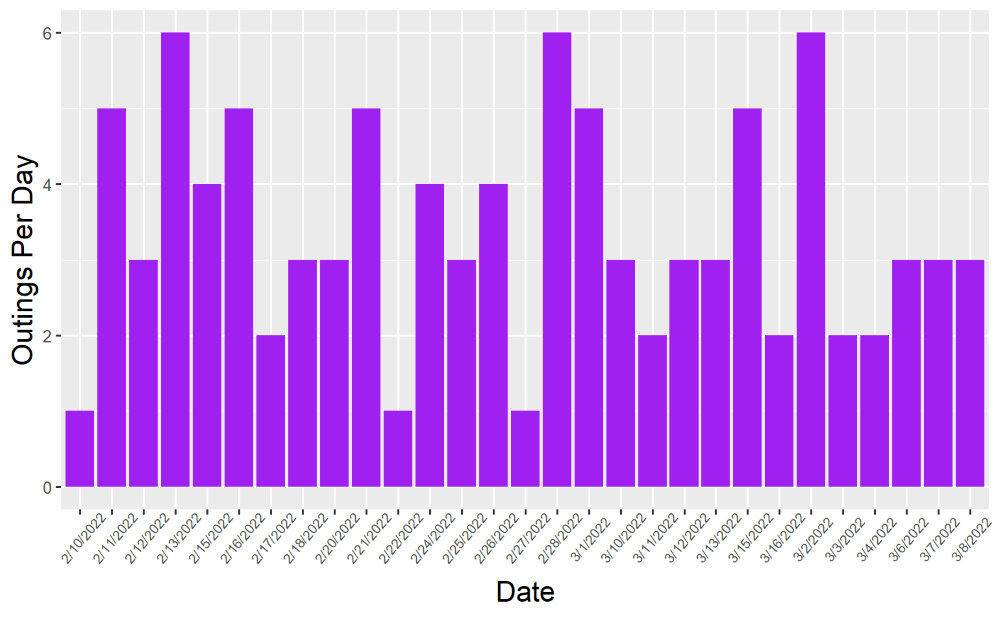
The graph that you see to the left is an example of an insight we can gain from data of this nature. It depicts the number of outings I had with my dogs each day for approximately one month. The average number of outings made each day was 3.37 outings with an average outing time of 16.38 minutes.


As you can see in the figures below, that adds up to quite a bit of time by the end of the week!


Part of the reason that weekly value can be so high for some people can be explained by a human mistakenly interpreting a signal from our pets as “needing to go outside” when they are actually attempting to communicate something else. The idea behind this project suggests that perhaps there are times that incorrection assumption of signaling leads to an outcome where an alternative outcome could potentially be more mutually beneficial.


For example, lets say that as a pet owner who must attend to their dog while they attend to their personal needs, each week I misinterpret four signals from my pet where I assumed they needed to go outside. The first time they were signaling because the ball was stuck under the couch, the second time before they wanted me to get an itch for them out of their reach, the third time was because they wanted to have some individual and some pets, and a fourth time where they wanted to play tug-of-war with a toy.


We know that each outing (in this case) lasts approximately 16 minutes. Let’s suppose the time-cost that would have been paid in an alternative reality where I correctly interpret fido’s signal each of the three aforementioned times as follows: 1 minute to retrieve the ball, 2 minutes for scratching the itchy spots, 5 minutes for giving some love and pets, and 10 minutes for a round of playing tug with the rope toy.


By the Numbers
16.38 Average Number of Minutes per Outing
3.37 Number of Outings per Day
55.20 Average Daily Total Outing Time in Minutes
386.4 Average Weekly Total Outing Time in Minutes (6.4 hours)


If you perform those simply calculations, you will see that the time-cost in Reality-A where I misinterpreted fido’s signs was about (16 minutes) * (4 outings) = 64 minutes or 1.06 hour. The time-cost paid in Reality-B for correctly interpreting fido’s signal and avoiding an “unnecessary” outing is valued at (1 minute) + (2 minutes) + (5 minutes) + (10 minutes) = 18 minutes.


WoooWee!! That’s an extra 46 minutes you now have each week thanks to a little data-driven analysis and some critical thinking to improve our ability to understand signals from our pets and trends in their natural bodily functions.


Now that we know what it's like to utilize the most basic functionlaity of this project, just think of the possible insignts that we could gain with a sufficiently sized data set, the application of modern statistical techniques with machine learning, and more to come. To consider a few examples:

. . .


The Methodology


App

In the context of the analysis of this project, we can generalize pet owners into one of two groups:

Group 1: The Homeowners

Homeowners are those whose primary residence is characterized by one (or more) of the following chracterics:

  • - Private yard with fenced property perimeter; includes invisible fences

  • - Property with range where fido is free to roam and lives at the residence

  • - Other characteristics that enable fido to regularly be outside unsupervised without concerns for fido's safety, worry to the owner, or potential concern to the public

Group 2: The Occupants

Occupants are those whose primary residence can be described as:

  • - Without an outside-accessible door from the dwelling; includes most leased units in apartments, condominiums, and townhouses/multiplexes without a yard or with shared areas

  • - Rented private room that prohibits animals in communal spaces

  • - Other characteristics that prevent fido from regularly being allowed outside unsupervised; each trip outside for the dog means a trip outside for the human


If you are a pet owner that identifies as Occupants belonging to Group 2, I'm sorry to say...

App
YOU ARE BEING DISCRIMINATED AGAINST AS A PET OWNER


This discrimincation is manifested with the assignment of cost-burden to each group. Since Landowners don't have to spent the time leash-in-hand escorting fido while they conduct their business, they are able to escaept the time-cost that is unavoidable to Occupants


As a pet owner I currently identify as an Occupant, meaning that every time either one of my dogs need to go outside, outside I go as well. Less than a year ago at my previous residence, I would have identified as a Landowner according to our definitions from earlier. After having experiencing pet ownership as a member of each group, I can personal attest to the noticeable time-cost difference.


Think back to the numerical example provided above with the data collected from my own dogs where, as an Occupant I spent an average of 55 minutes on outings daily at the time the data sample was collected. Even if the number of outings required for Bucky are the same when I was a Landowner as they are for me now as an Occupant, the total-time cost is and was still substantially (while I didn’t collect the data at the time to corroborate my claim, I hope you can trust me. I miss a fenced yard.


Suppose we are generous in assigning a value to “Average Number of Outings per Day” and say 6.2 outings (as opposed to 3.37 from before) for the Landowners. Suppose the time-cost per outing for a Landowner includes the time to get up, walk to the door, open/close the door, sit back down, and repeat the process when fido is ready to come back in. We will estimate this total to be 3 minutes. That would put the average daily outing time for Landowners at 18.6 minutes, meaning a time-cost difference of 36.6 minutes less compared to the daily average for Occupants (according to our data) and 256.2 minutes less than the weekly average.


Looking back and reflecting on my personal experience, I’d say that sounds about right.


Thus we are brought back to the vision for the project. While it is unlikely that an Occupant would be able to lower their expected time-cost to the same level that of a Landowner, an average weekly total of 250 minutes sounds better than 386 minutes. Now if only their was some sort of workflow or scripting that would allow us to monitor such data with ease….


. . .


The Data


    This page/project is still in development. Please enjoy a preview of the project code below in the meantime until future enhancements are made :)